Dashboard Overview
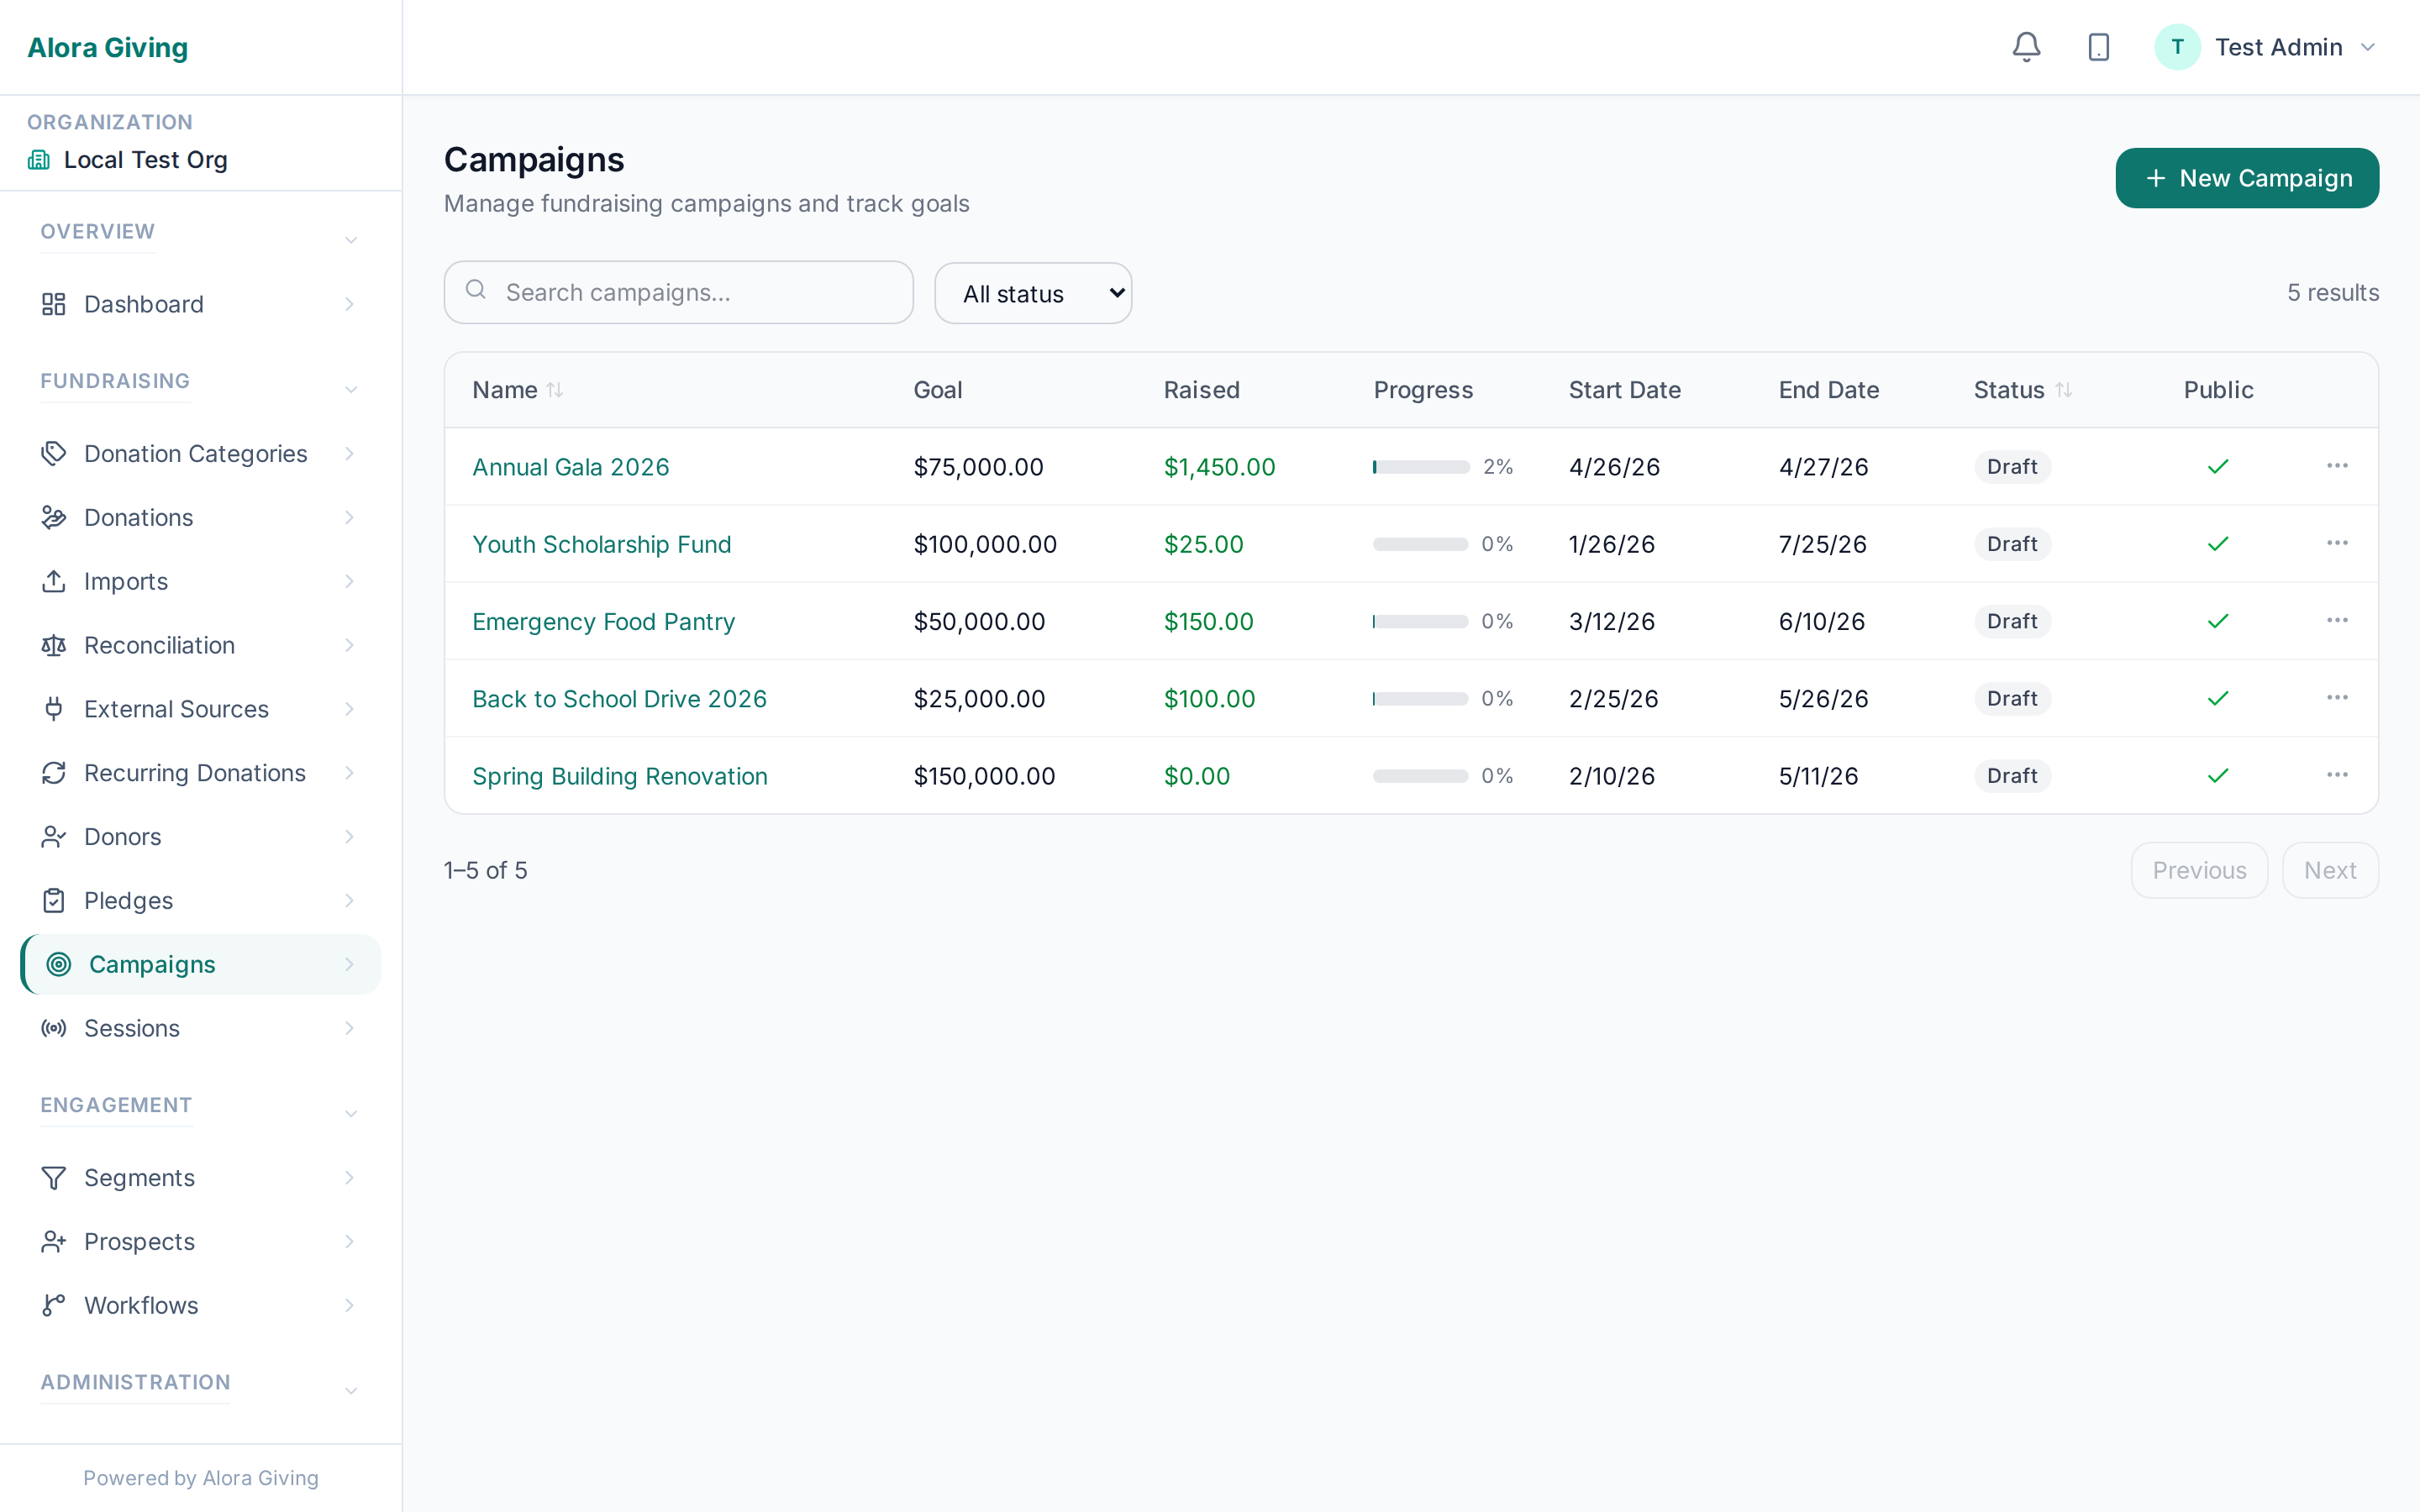
Campaign Progress
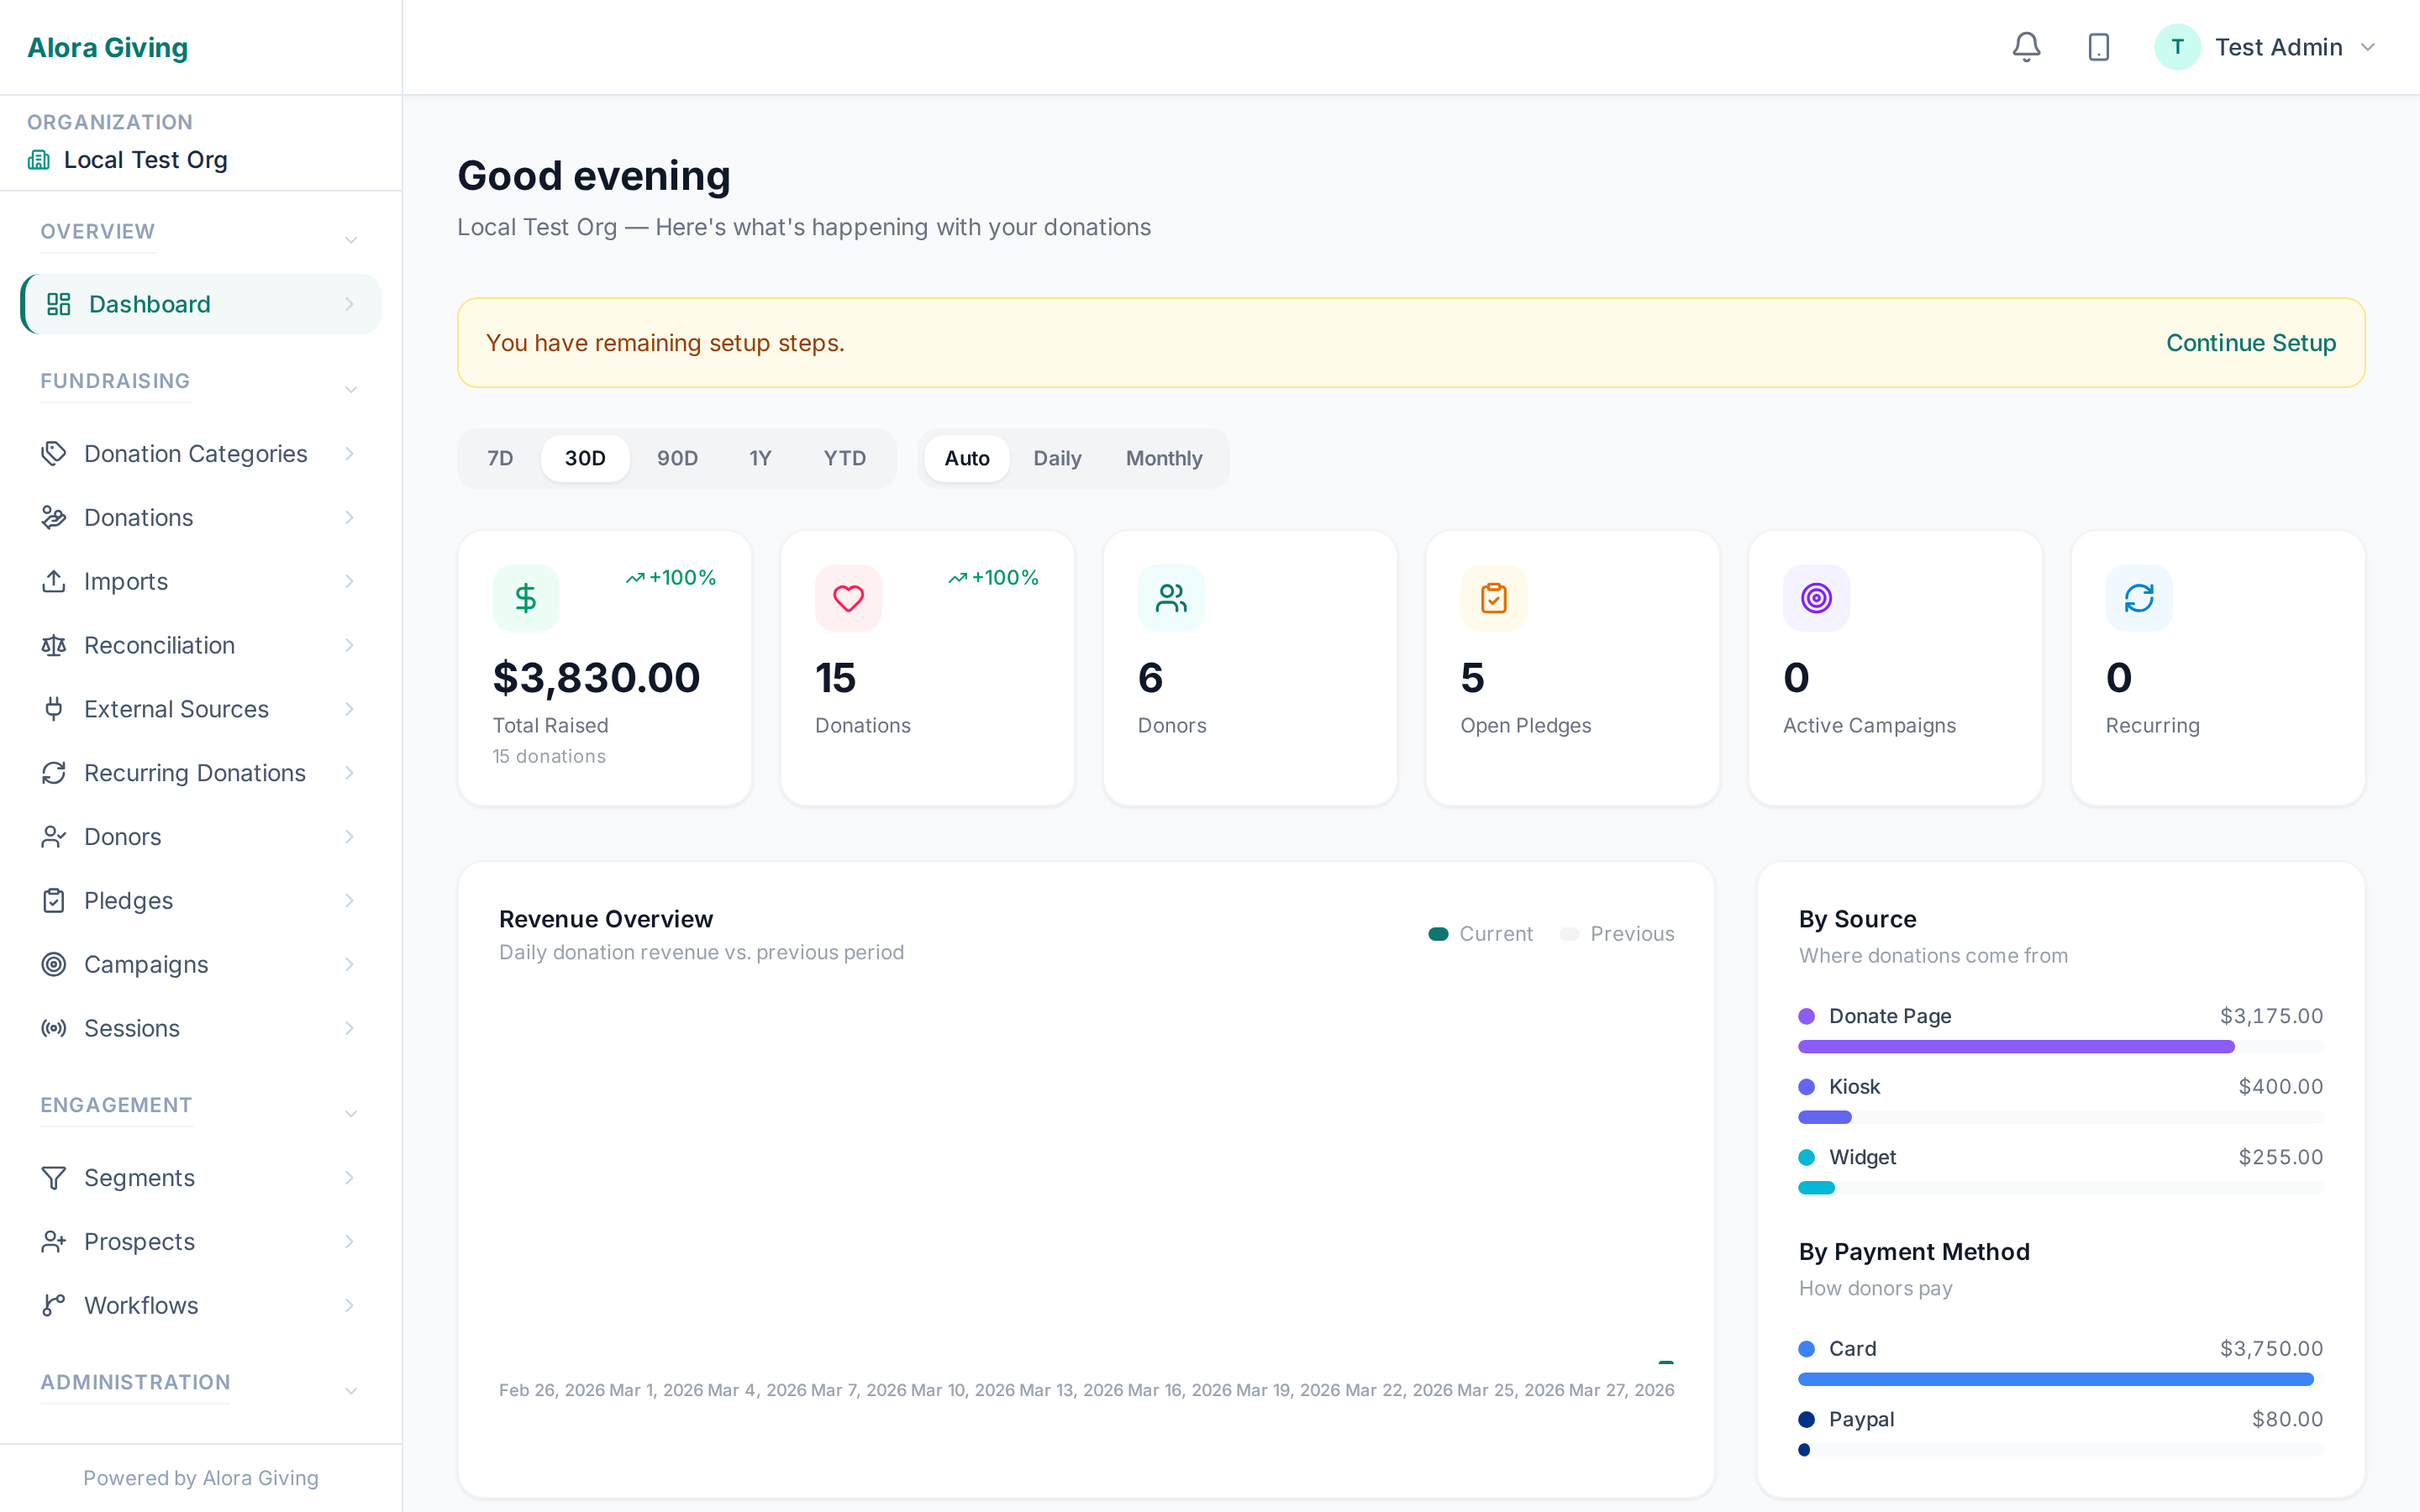
Real-time dashboards, a daily AI-generated briefing, project health scoring, and designation-level breakdowns — answers to the questions leadership actually asks, without spreadsheets.
AI-powered insights
Not a dashboard you have to decode. A 3-5 sentence email every morning: yesterday's total, new supporters, campaign progress, anything needing attention. Written in your language, using your vocabulary.
Donors are automatically classified — new, active, lapsed, high-value — based on giving history, recency, and amount. The stages drive both reporting and automation; the segments stay current as behavior shifts.
See giving by program, project, fund, or cause — however your organization structures its work. NGOs see program-level aggregates with child project details. Churches see fund-level summaries.
How does your average gift compare to similar-size orgs in your tradition? Privacy-preserving k-anonymity aggregates show you peer context without exposing individual donor data — yours or anyone else's.
Donations, donors, pledges, recurring subscriptions, campaign results — all exportable to CSV from any list view. Your data is yours; download whenever, no restrictions.
Every change to every record — who, when, why. Discovery-ready if a regulator asks. Filterable by user, date range, entity, or action.
Questions answered
Revenue trend chart with period comparison — 7 days, 30 days, 90 days, and year-to-date.
Breakdown by donation category with totals, averages, and supporter counts.
Channel split — website, kiosk, app, donate pages, and manual entry at a glance.
Ranked by highest giving, most frequent, or recently active — with links to their profiles.
Campaign cards showing goal, raised amount, percentage, days remaining, and subscriber count.
Pledge summary — total committed vs. fulfilled vs. outstanding, with lapse alerts highlighted.
Cross-org benchmarks — average gift, retention rate, recurring share — all aggregated across peer orgs in your tradition. No individual data exposed.
Lifecycle-stage filter for at-risk + lapsed donors with last-gift date and giving history. Triggers automation workflows when stage transitions occur.